SIMALTO
was originally conceived for the purposes of product development and pricing -
its first applications were on trucks, copying machines and automobiles.
This SIMALTO invention was prompted by the artificiality of the then in vogue
(late 1970s) pair-wise conjoint methods involving many presentations of option
choices on the PC for the respondent to pick his preferred alternative.
The
utilities previously assigned to each of these options in the trade off were
changed a little, and then presented yet again in different combinations - and
so on until convergence of stability of all utility estimates, or boredom on the
part of the respondent (when he gave up).
Why
not simply ask what options people want, and which of these would they pay for,
and how much? Such a blindingly simple approach could not have waited
until 1979 to be invented! Indeed, and Ford showed the author a grid of
car attributes and options, with prices on them, circa 1947. (In those
days plastic seats cost more than the leather seats - new technology always had
inflated prices until the novelty wore off.)
Before
the organised and cost constrained option selection of the SIMALTO grid was
promoted, some methods simply presented each option and asked if it was wanted
and if so how much would they pay for it. This had the problems that each
option tended to be seen individually (not necessarily as part of a total
product with its other strengths/weaknesses) and respondents could spend the
same money "twice". A final totalling of the bill tended to
cause more respondent disappointment than a true revision of his priority
spends.
The
breakthrough in SIMALTO occurred in the mid-1980s when fast PCs enabled
rule-based expert systems to combine all the sensible standalone data from the
SIMALTO grid into reliable forecasts of which combinations of options, at what
price, would be preferred, by what number of customers, to a rival combination(s).
![]()
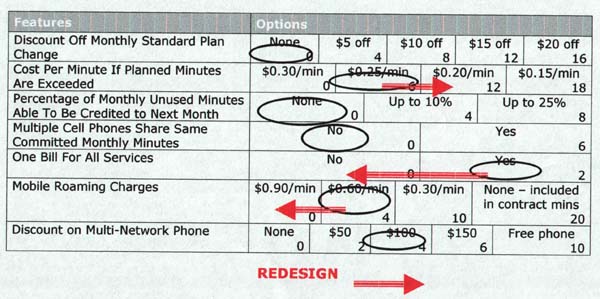
A grid is presented, as below, with all the attributes and different options in view, preferably simultaneously. One option in each attribute is marked (circled) as the starting point for the exercise. This circled position may be the respondent's perception of his current product or one supplied as a common start point for all respondents (particularly relevant for new products where previous use may not occur).
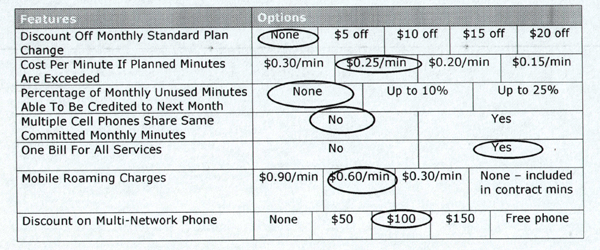
On this grid, optionally, several tasks are completed. The respondent:
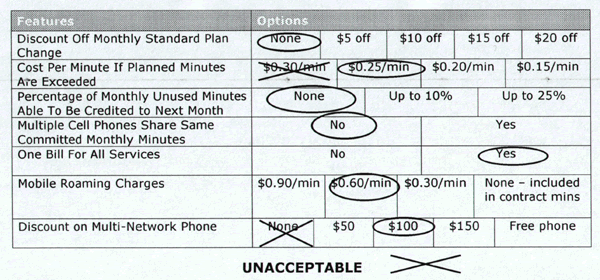
1. Crosses out options that would be unacceptable to him, i.e. the product would not be able to perform the work expected of it if it had these optionse.g. on a telecom package for monthly commitment to both fixed and mobile phone calls
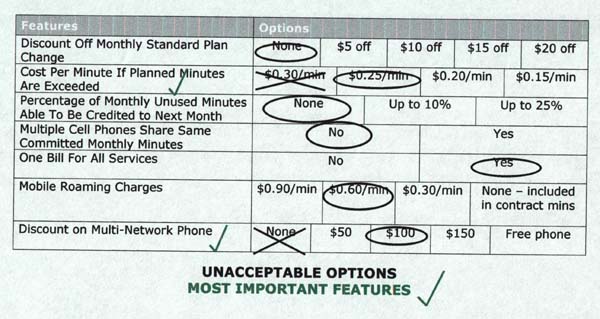
3. Indicates some preset number of 'free' improvements to the circled specification
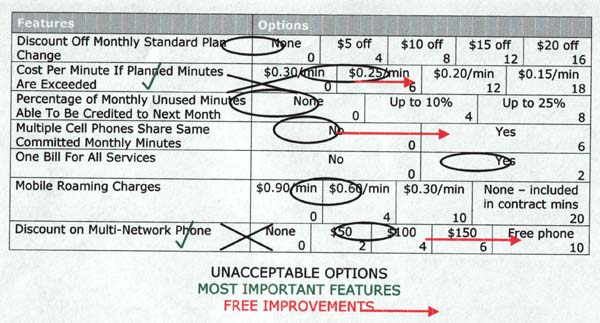
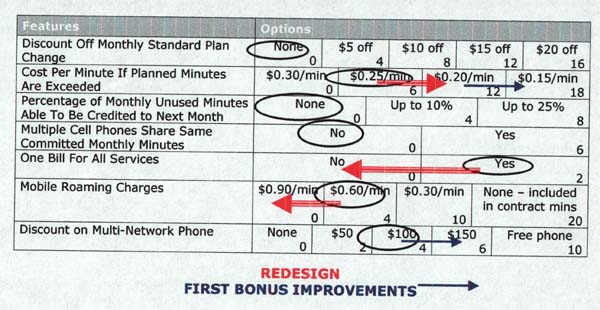
The
respondent is now asked to focus on the numbers in each cell of the grid which
show the relative prices of the options. In the real world some
improvements cost more than others and real life customer choices reflect these
costs.
The respondent now completes two or more of the following tasks:
1. Re-designs
the first set of circles position so the sum of any improvements he desires
is matched by the series of savings he must make to ensure a net zero sum
cost change.
2. Allocates a pre-set budget to indicate his priority improvements to the previous specification
3. Repeats
Stage 2 with more pre-set budgets
4. Indicates how he would make a saving(s) of preset amounts to the original specification.
5. Finally, the respondent is usually asked how much he would really pay (need to save) for each of the above scenarios, and indeed which would be his preferred scenario at some sensible price.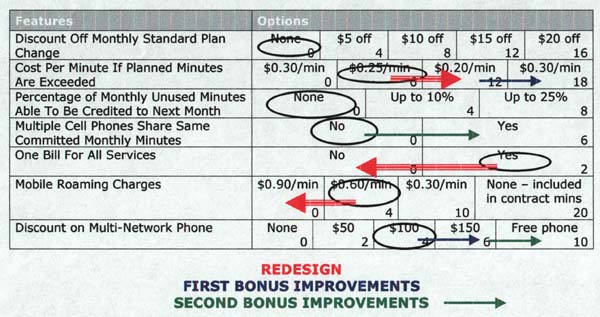
The benefits of this
approach are discussed in the Methodological Advantages section. This
transparent and logical process allows customers to behave much as they do in
the real world when making decisions involving products and prices - i.e. making
significant purchases in a competitive product environment. All decision
factors are considered together in the total product context and in relative
proportion in a procedure which follows a logical, clear and incremental path,
taking respondents forward in steps that make sense.
Price is used as a
constraint on customer choices both at product option and total product levels,
thus allowing natural limitations of cost/ affordability to determine trade offs
which are made, and thereby generate models of requirements which reflect what
customers are willing and able to pay for, and not merely what they would like
to have in an ideal world.
Even the range of price each individual customer respondent is prepared to pay for an appropriate specification – his minimum and maximum price – can be integrated into product preference forecast simulations.
![]()
![]()